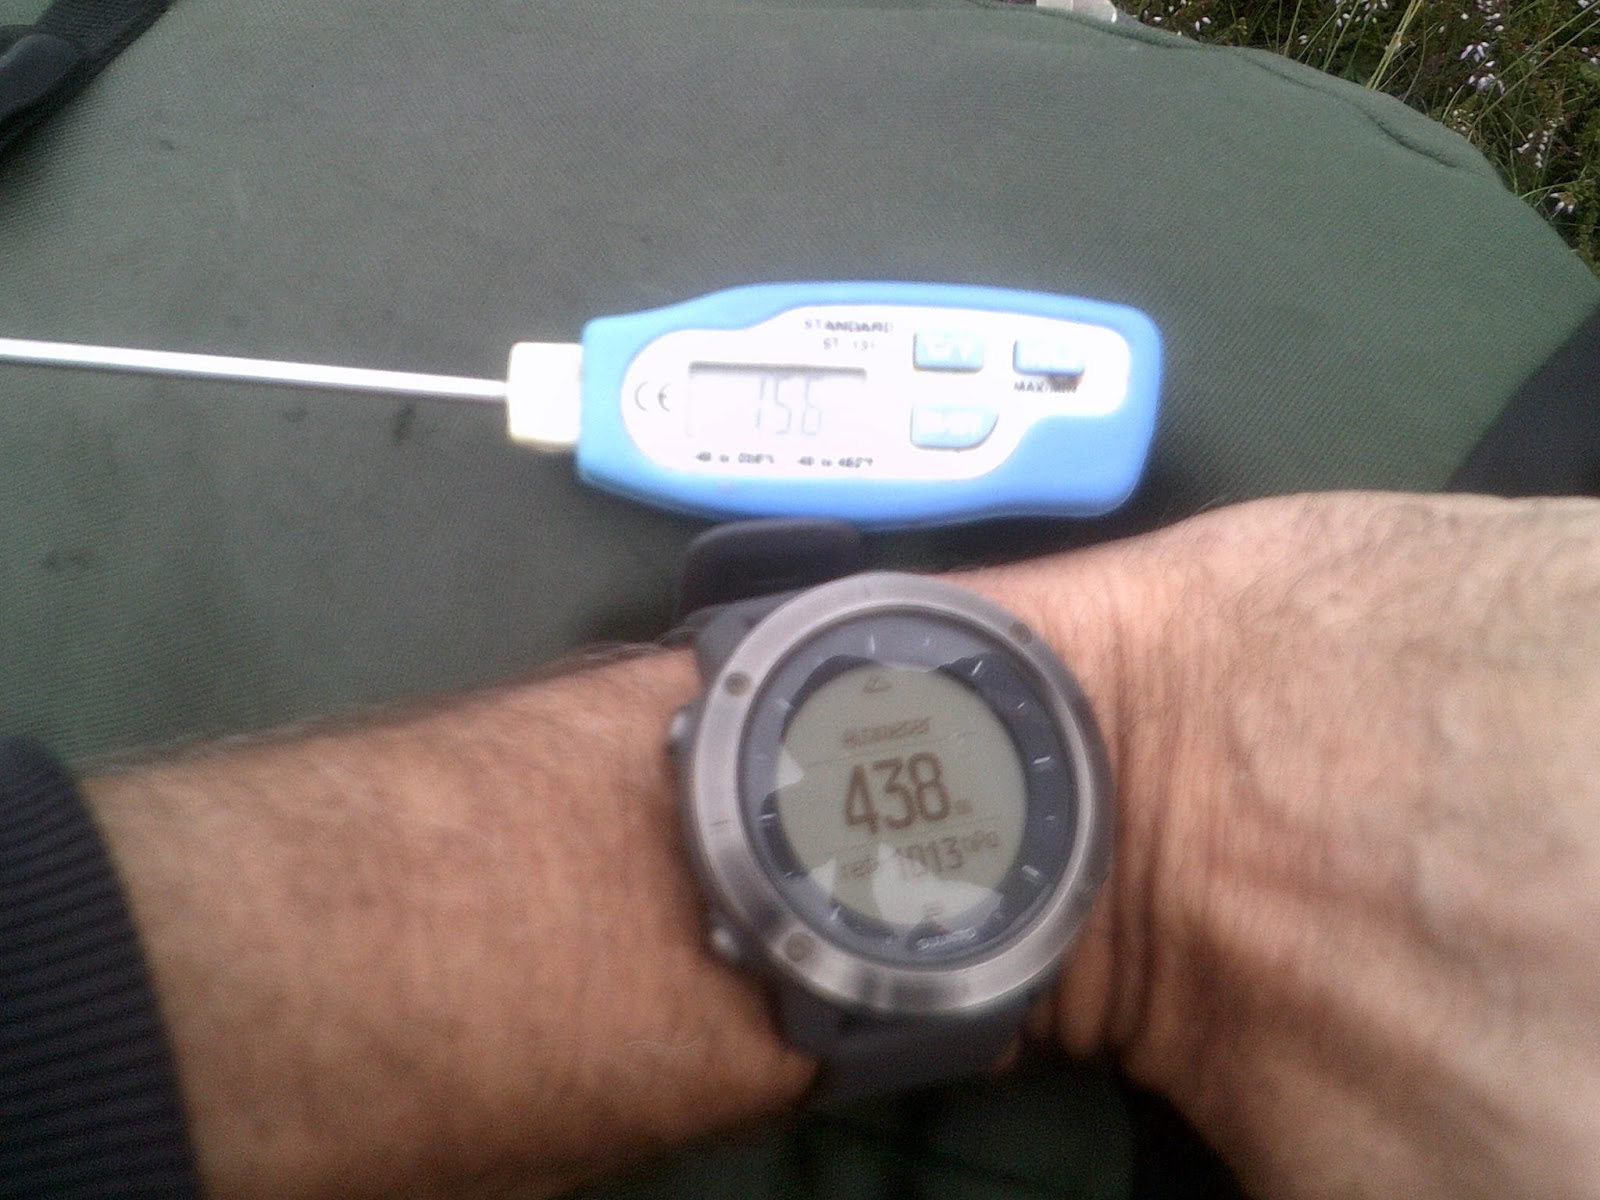
I climbed Barrow on Activities Day. I borrowed a watch with a height readout and measured the temperature at different heights. Here is some of the data
Here is a graph of all of the data:
The temperature falls with height. My data has a gradient of 0.0165 degrees Celsius fall per metre. That's 1.65 degrees Celsius per 100m or 16.5 degrees Celsius per km. The R squared value is low so the data is not that good. The third data point was a clear anomaly. This fall of temperature with height is called the lapse rate. It is explained here
https://en.wikipedia.org/wiki/Lapse_rate I need to do more work on the thermodynamics theory but the value I should have got was 9.8 degrees Celsius per 1km so I have a percentage difference of nearly 70%. I knew we would be climbing quickly so that should have eliminated the time of day factor of solar heating and it was dull all morning.